The 2018 USAU Triple Crown Tour has just concluded with the National Championships. This year’s championships were held in Southern California, 20 miles or so north of San Diego. Pool play and early placement rounds were held at the Surf Cup Sports Complex in Del Mar. 5 of the semifinals and the 3 finals were held at the Mira Mesa High School Stadium. The Surf Cup fields are the grass remnants of the former San Diego Polo Club and started in excellent condition and remained playable for the entire duration of the tournament. The school stadium field turf was in excellent shape as well.
At the tournament, I was able to chart 15 selected games in detail. I’ll present that data a bit further down.
Triple Crown Tour Review
For those of you who are relatively new to the game at this level, here’s a quick history of the Triple Crown Tour (TCT).
Prior to 2013, club teams would attend various random tournaments in preparation for Sectionals. Teams would decide which tournaments they wanted to attend and then some tournaments would extend invitations to certain teams. This idea worked well for many years but it soon became chaotic with some tournaments being scheduled on the same dates. Some tournaments became team gender specific as well as competition grew. For teams, the decision of which tournaments to attend became more difficult.
USAU studied the situation and implemented the TCT starting in 2013. In its current configuration, the 700+ active USAU club teams are grouped into 4 Flights for each team gender.
The 4 Flights are:
- Pro Flight Top 8 teams from last year’s Nationals
- Elite Flight Next 8 teams from last year’s Nationals
- Select Flight Top 4 teams from each region who did not make Nationals
- Classic Flight Everybody else
The largest pre-TCT tournaments were chosen to host the special tournaments in the TCT series. Some of the early tournaments were held in multiple locations based on team gender. As currently configured the series looks like this:
Regular Season
- Pro-Elite Challenge
- Select Flight Invite
- U.S. Open Club Championships
- Elite-Select Challenge
- Pro Championships
Post Season
- Sectionals
- Regionals
- Nationals
Winning the “Triple Crown” consists of winning the current season’s U. S. Open, Pro Championship & National Championships.
Analyzing the TCT Data
Analyzing the TCT requires access to data. The guaranteed amount of data is limited. When comparing current and historical, the situation is just a limited. Very little information was saved in the early days.
Available information:
- Location
- Time/Date Stamp
- Team Names
- Team Scores
- Game to Score (inferred)
- Team Gender
- Seeding (sometimes)
Calculated Parameter
For this article, I’ll make use of the existing recorded data and calculate the metric Aggregate Performance Index (API) for game comparison purposes.
API = (Total Points Scored) / (2 x Game to Score)
Examples:
Team A 15
Team B 12
Game to 15
API = (15+12)/(2×15) = 0.90 = 90%
Team C 9
Team D 6
Game to 13
API = (9+6)/(2×13) = 0.58 = 58%
You can see that the API metric yields a way to compare games played to a different number of points and still produce a rough estimation of game quality.
2018 TCT Tournament Performances
For comparison purposes, the following TCT tournaments are included.
- Pro-Elite Challenge
- Select Flight Invite
- U.S. Open Club Championships
- Elite-Select Challenge
- Pro Championships
- Nationals
I did not feel that Sectionals & Regionals were consistently representative of the sport at the highest levels.
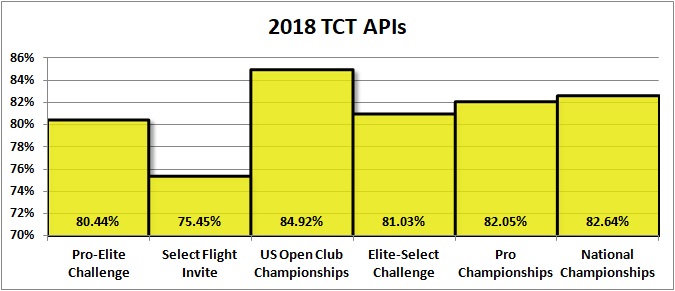
Here are the API’s of the selected 2018 TCT tournaments:
Comments:
Somewhat surprisingly, the US Open had the highest performance of all the 2018 season tournaments. In spite of its name, the Open is an invitational tournament and includes the best teams from the USA and around the world.
The National Championships had the second highest performance, edging out the Pro Championships. The difference is so small however that it may not be statistically significant; I haven’t done the calculations.
As expected, the Select Flight Invite has the lowest performance.
2018 TCT Compared to Past Years
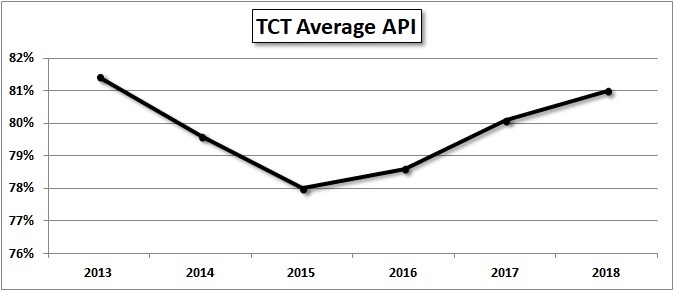
If we combine all the Tour data into a single API we get this for the Tour each year since its inception:
Comments:
Don’t be distracted by the years 2013 & 2014, the Tour was still in its infancy and not all the current teams, team genders & skill levels were included. As the Tour became more inclusive with time, the performance values dropped and became more representative of the performances across the sport.
Once the Tour events stabilized, the growth within the sport becomes apparent.
Winners & Losers
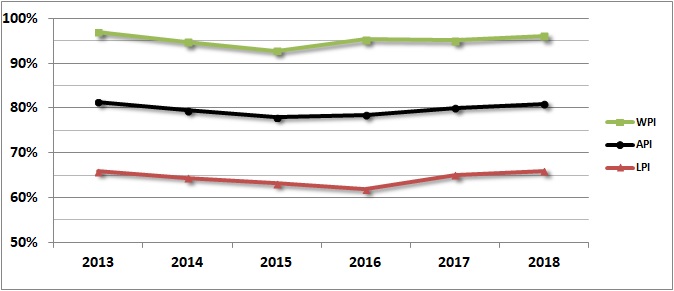
The TCT chart above is the aggregate of both teams in any logged game. We can gain more insight into how ultimate is growing by separating the data by the performance of the winners (WPI) & the losers (LPI).
Comments:
There is a 20% performance difference between winning and losing teams. Most future growth in the sport will come from making weak teams stronger.
TCT Compared to the WFDF
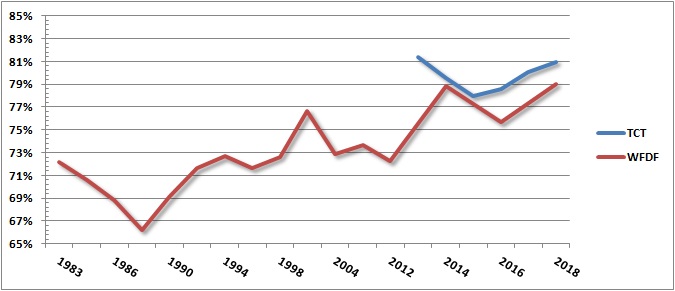
It’s always interesting to compare the growth of the sport nationally and internationally. Here’s how the USAU TCT performance stacks up when compared to the WFDF Worlds:
Comments:
WFDF Worlds data is quite sensitive to tournament location. Remote, more remote locations attract more local & regional teams with less attendance by the more distant world powers, hence the dips & spikes in the WFDF data.
I did not include past USAU tournaments. It would have been too controversial to select certain tournaments in an attempt to recreate a proxy TCT season. I would have introduced a bias in the data which would bring question into its veracity.
It’s still too early to tell for sure, but the world may be catching up to the USA.
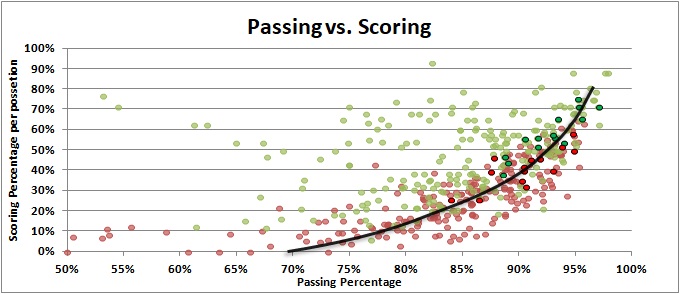
Passing vs. Scoring
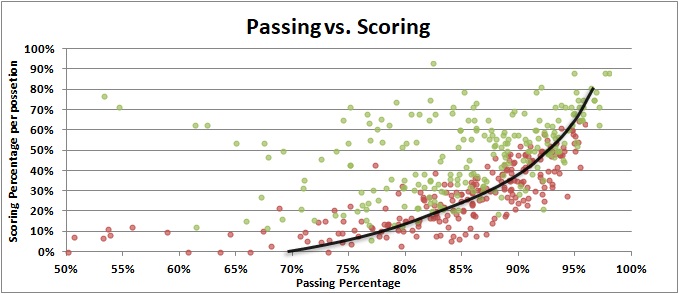
I’ve been collecting detailed passing and scoring information since 2010 when I started traveling with Sockeye. I continued collecting data after I moved on and started youth coaching. Since that time I have personally recorded 226 games from all different skill and gender levels.
Here’s a chart of that data:
Comments:
Green dots are winning performances.
Red dots are losing performances.
The data represents Club, College & High School games.
I’ve added a hand-drawn trend line at the split of probably winning and probably losing.
You can see a pattern of performance emerging.
I need more data as I am beginning to see other trends within the chart.
Recipe for Success
To be successful at ultimate you need to achieve 2 things:
- Passing at a greater than a 95% completion rate.
- Being aggressive enough downfield such that you can score greater than 70% of the time whenever you pick up the disc.
Specific Tournaments
For selected games at the 2018 USAU Nationals I recorded passes, turnovers and scoring. I recorded these games:
| Winning Team | Score | Losing Team | Score | |
| Revolver | 15 | vs. | Sub Zero | 11 |
| Sockeye | 14 | vs. | Doublewide | 11 |
| Mixtape | 15 | vs. | Jughandle | 7 |
| Riot | 15 | vs. | Ozone | 10 |
| BFG | 15 | vs. | No Touching! | 8 |
| Ring of Fire | 14 | vs. | Doublewide | 10 |
| Fury | 15 | vs. | Wildfire | 8 |
| Drag’n Thrust | 15 | vs. | Mischief | 12 |
| AMP | 15 | vs. | Spaceheater | 14 |
| Revolver | 15 | vs. | Ring of Fire | 14 |
| Brute Squad | 15 | vs. | Molly Brown | 11 |
| Fury | 14 | vs. | Riot | 13 |
| AMP | 15 | vs. | Mixtape | 8 |
| Fury | 14 | vs. | Brute Squad | 13 |
| PoNY | 15 | vs. | Revolver | 7 |
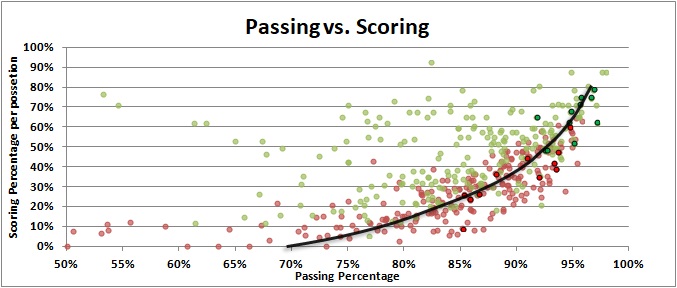
With the 2018 Nationals data superimposed on the passing vs. scoring chart, this is what you see:

Comments:
The recorded 2018 USAU Nationals games follow the trend line nicely.
WMUCC
Next I thought I’d highlight the 2018 WMUCC games I recorded in Winnipeg. This is what I recorded:
| Winning Team | Score | Losing Team | Score | |
| Sun | 15 | vs. | Quantum | 5 |
| Johnny Encore | 15 | vs. | Mexico | 7 |
| Johnny Encore | 15 | vs. | Quantum | 5 |
| Johnny Encore | 15 | vs. | Torque | 2 |
| Johnny Encore | 15 | vs. | Sun | 7 |
| Johnny Encore | 15 | vs. | Iron Crow | 3 |
| Johnny Encore | 15 | vs. | NSOM | 11 |
| All Bashed Out | 14 | vs. | Johnny Encore | 13 |
| Johnny Encore | 15 | vs. | Rest Stop | 6 |
| Boneyard | 15 | vs. | All Bashed Out | 8 |
| iRot | 15 | vs. | Mu-Syozoku | 11 |
| Molasses | 15 | vs. | 512 | 13 |
Comments:
My son was playing for Johnny Encore, hence so many Encore games are represented.
International play follows the trend line as well.
Conclusion
Ultimate is improving in the USA.
Ultimate is improving around the world.
It is unclear if the world is catching up to USA Ultimate
With the limited amount of seasons available, it is still somewhat unclear if the improvements in USA Ultimate are due to the Triple Crown Tour.


Comments Policy: At Skyd, we value all legitimate contributions to the discussion of ultimate. However, please ensure your input is respectful. Hateful, slanderous, or disrespectful comments will be deleted. For grammatical, factual, and typographic errors, instead of leaving a comment, please e-mail our editors directly at editors [at] skydmagazine.com.