I didn’t set out to do this article. My intent was merely to add more games to my scoring database in support of the several articles I currently have in work. Once I went on out to the USA Ultimate website, explored a bit and saw all the age-restricted sanctioned divisions that held a National Championship Tournament I got this idea. Hmmm, at the end of the year, I wonder how they compare to each other. As usual, I have restricted myself to National Tournaments as to not get caught up with regional differences, so this was perfect for a quickie analysis.
I found:
- YCC – U17 boys, girls
- YCC – U20 boys, girls & mixed
- College D-III men & women
- College D-I men & women
- TCT men, women & mixed
- TCT Masters men, women & mixed
- TCT G Masters men & women
- TCT GG Masters men & women
Standards for comparison
USAU has done much in the past years to standardize some aspects of the game, thus making comparisons more meaningful with each passing year. In this case, all games were to 15. The standardization is not quite complete yet. Standardization still breaks down somewhat in-game durations and in bracket formats. A more formalized time between game starts and a more consistent bracket format across tournaments would give a more uniform number of games played. I do have to admit though; I’ve been impressed with the reduced number of double forfeits in the later stages of a tournament since the implementation of the TCT.
Comparison MoMs
Way back when I was a systems analyst, we had to come up with a Measure of Merit (MoM) for any system we were tasked to evaluate and then optimize. I use the term MoM, but it isn’t the only one you’ll see, sometimes you’ll see the term Figure of Merit (FoM) used instead. The terms are interchangeable. Selecting the right MoM for your analysis is important. If you’re designing a commercial airliner, you’ll use the MoM; Cost per Available Seat Mile (CASM). There’s Projected Return on Investment (ROI) for marketing. If you’re buying a car, you’ll use miles per gallon (MPG) or Horsepower (HP) as your MoM. Any serious study of Ultimate’s performance will need to have well-defined evaluation criteria.
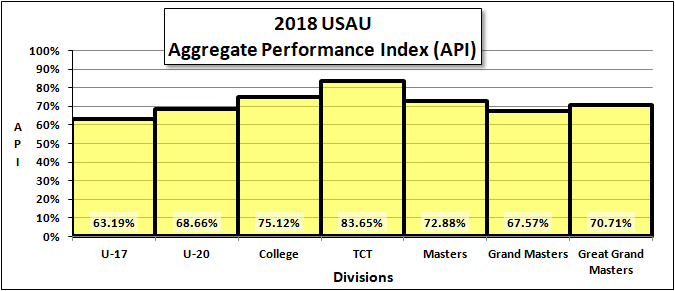
When analyzing Ultimate, I use several different MoMs depending on what I’m looking for. For assessing the general quality of a game, I use the Aggregate Performance Index (API). The API is merely Total Points Scored in a game divided by the Total Points Available.
For instance, in a game to 15, ending with a 15 – 13 final score, the API would be:
API = (15 + 13) / 30 = 0.93 or 93%
In a game to 15, ending with an 8 – 5 final score, the API would be:
API = (8 + 5) / 30 = 0.43 or 43%
It should be obvious that the higher the API, the higher the quality of the game.
Another Important, yet much less popular MoM I use is the Spectator Viewing Index (SVI). The SVI is the API times the Scoring Differential Index (SDI), giving a sense of if the game is both high scoring and closely contested. After all, we all want to watch high scoring close games.
The SDI is calculated using the Winning Score and the Point Differential.
SDI = 1 – (Point Difference – 1) / Winning Score
The equation looks complicated, but it really isn’t. I had to manipulate the equation just a bit to make 1.00 a good score and 0.00 a bad score (something called normalizing).
From the above examples:
In a game to 15, ending with a 15 – 13 final score, the SVI would be:
SVI = API * SDI = 0.93 * 0.93 = 0.87 or 87% (a pretty good game)
In a game to 15, ending with an 8 – 5 final score, the SVI would be:
SVI = API * SDI = 0.43 * 0.75 = 0.325 or 32.5% (perhaps not a very good spectator experience)
Why is the SVI important? Well, the teams all want lower tournament fees and higher cash prizes. That money has to come from somewhere. In the end, it will need to come from the marketing departments of the sponsors & advertisers. The sponsors & advertisers want to get the highest possible return on their marketing investment and will insist on game matchups with the highest potential SVI. Even now, tournament field assignments are being adjusted to showcase the best matchups available within the USAU’s self-imposed equity-sensitive game allocations.
SVI will not be used as a MoM in this article; I just wanted to introduce the concept as it will be an important part of future articles.
The 2018 USAU Games
| Division | Tournament | Team Genders | # Games |
| YCC U-17 | US Open Club Championships | B & G | 92 |
| YCC U-20 | US Open Club Championships | B, G & X | 197 |
| College | D-III College Championships
D-I College Championships |
M & W | 192 |
| TCT | US Open Club Championships
National Championships |
M, W & X | 285 |
| Masters | National Masters Championships | M, W & X | 118 |
| Grand Masters | National Masters Championships | M & W | 70 |
| Great Grand Masters | National Masters Championships | M & W | 42 |
Finally, the data
Notes:
No statistical analysis was undertaken. As expected, the quality of Ultimate improves with the skills and the maturity of the players, climaxing with the TCT Division. Division API scores are strongly influenced by team gender inclusion (explained in a future article). Grand Master APIs are uncharacteristically low because of a number of completely unprepared teams participating in the National Championships.
Split Indexes
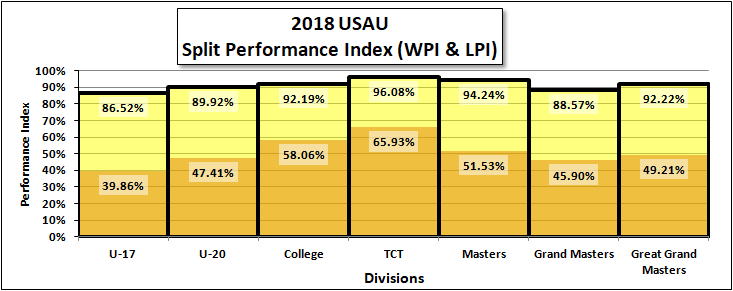
Whenever I show someone the API chart they always seem to question whether it is meaningful since after all, it averages the winning and losing scores. I have to remind them the API does not show the quality of a single team’s game. It is more of an indication of the quality of the game. After all, if on the average both teams are improving, doesn’t that mean the sport is improving? But I did calculate the individual numbers in question. I do have both the Winning Performance Index (WPI) & the Losing Performance Index (LPI) numbers. But enough bellyaching here’s the chart.
Notes:
The WPI & LPI follow the same trend as the API. The gap between winning and losing teams reduces up through the TCT. After the TCT Division, the gap opens back up and seems to hold constant (at least it did in 2018). As of this article, I have 8,979 games in the database.
Conclusion
None really, just a fun little look at the data.


Comments Policy: At Skyd, we value all legitimate contributions to the discussion of ultimate. However, please ensure your input is respectful. Hateful, slanderous, or disrespectful comments will be deleted. For grammatical, factual, and typographic errors, instead of leaving a comment, please e-mail our editors directly at editors [at] skydmagazine.com.